UNITED STATES
SECURITIES AND EXCHANGE COMMISSION
Washington, D.C. 20549
FORM 6-K
REPORT OF FOREIGN PRIVATE ISSUER PURSUANT TO RULE 13a-16 OR 15d-16 UNDER THE SECURITIES EXCHANGE ACT OF 1934
For the month of June, 2021
Commission File Number: 001-38714
STONECO LTD.
(Exact name of registrant as specified in its charter)
4th Floor, Harbour Place
103 South Church Street, P.O. Box 10240
Grand Cayman, KY1-1002, Cayman Islands
+55 (11) 3004-9680
(Address of principal executive office)
Indicate by check mark whether the registrant files or will file annual reports under cover of Form 20-F or Form 40-F:
| Form 20-F |
X |
Form 40-F |
Indicate by check mark if the registrant is submitting the Form 6-K in paper as permitted by Regulation S-T Rule 101(b)(1): ☐
Indicate by check mark if the registrant is submitting the Form 6-K in paper as permitted by Regulation S-T Rule 101(b)(7): ☐
SIGNATURE
Pursuant to the requirements of the Securities Exchange Act of 1934, the registrant has duly caused this report to be signed on its behalf by the undersigned, thereunto duly authorized.
| StoneCo Ltd. | |||||
| By: | /s/ Thiago dos Santos Piau | ||||
| Name: | Thiago dos Santos Piau | ||||
| Title: | Chief Executive Officer | ||||
Date: June 1, 2021
EXHIBIT INDEX
| Exhibit No. | Description |
| 99.1 | StoneCo Ltd. Press Release dated June 1, 2021 |
Exhibit 99.1


1Q21 Earnings Release
June 1st, 2021
investors.stone.co
1
StoneCo Reports First Quarter of 2021 Financial Results
George Town, Grand Cayman, June 1, 2021 - StoneCo Ltd. (Nasdaq: STNE) (“Stone” or the “Company”), a leading provider of financial technology solutions that empower merchants to conduct commerce seamlessly across multiple channels, today reports its financial results for its first quarter ended March 31, 2021.
“Dear Shareholders,
As the pandemic unfolded in Brazil in the first quarter and up to May, we continued to work hard to stay close to our clients and bring to them the best service and solutions. We monitored their level of activity closely, as well as how vaccinations and economic activity evolved in Brazil and in other countries. Based on (i) our learnings with lockdowns last year, (ii) recent client transactional data and (iii) learnings from the dynamics of countries where vaccines are widespread, we expect that once vaccination scale (which we think will happen in the second half of 2021), the economic recovery will be fast and - although delayed - Brazil is moving in the right direction. For these reasons, we have made an informed decision to be ready for recovery by investing in growth.
In the first quarter, we decided to increase our salesforce headcount by 24%, marketing investments by 33%, customer service and logistics headcount by 32% and technology headcount by 20%, in order to be the fastest player when our economy comes back to normal levels.
We have a high quality and solid core business in terms of growth, profitability and cash flow generation that continues to scale both in terms of client base, TPV and engagement of clients with new solutions, that we build on our new Financial Operating System for SMBs.
Our SMB core business presented strong growth metrics in the quarter and to date: our active payments clients in SMBs grew 67% in the quarter versus last year, achieving 857.8 thousand active clients. Additionally, 257 thousand clients are active in our digital account and of those, 188 thousand use it as their banking domicile, settling all of their transactions in the Stone Account. Overall SMB TPV grew 45% in the first quarter versus last year, with strong acceleration in the second quarter to date: TPV grew 122% in April and 111% in May up to May 20th. While April and May compare to weaker comps due to lockdowns in the second quarter of 2020, we still see strong growth acceleration when looking at a two-year CAGR, of 42% and 50% annual growth respectively in April and May to date.
In terms of revenue and profitability in our core SMB operation, our Take Rates decreased from 2.20% in the 1Q20 to 1.87% in the 1Q21, due to additional provisions on our credit product caused by commerce restrictions. Excluding these effects, we believe our Take Rates would have been 2.22%. Even though we have experienced R$116 million impact in revenue reduction, our credit portfolio grew and remains healthy, reaching a risk adjusted return net of funding costs between 1.5% and 1.9% on a monthly basis, notwithstanding the short-term impact from Covid. We continue to evolve in our strategy to fund our product with third party capital and thus limit our exposure to credit risk. We have recently concluded another issuance of FIDC, raising additional R$ 340mm in third party capital. In total, we now have available R$833mm in third party funding to be disbursed in our credit operation.
Regarding our vision and product evolution, we are building a Complete Financial Operating System for SMBs. In the past, we took the approach of building separate solutions as it was the best way to grow fast, learn about the market and gather client feedback. We have now decided to integrate our solution set and we have already migrated approximately 70% of Stone SMB client base to our new platform.
Regarding our software strategy, we will continue to invest in and acquire brick and mortar POS/ERP solutions built by great people and focused on strategic verticals where we have great chances of (i) integrating our financial operating system and (ii) executing on the digitization of commerce in order to help our clients to sell online. The acquisition of Linx (which is still pending anti-trust approval) is a big step towards our vision and will broaden our vertical coverage as well as expand our set of digital solutions. Our current software solutions grew pro-forma revenue by 43% organically to R$55 million in the first quarter of 2021. If we consider the acquisition of Linx, our pro-forma revenue in the quarter would be R$286 million, or a R$1.1 Billion on an annualized basis.
By executing both on the Stone SMB core business and our software strategy we believe that we will be in a much stronger position to capture the evolution of the approximately BRL 4.7 Trillion GMV of household consumption. We seek to be the player that can best help our merchants to do business and reach consumers. To that extent, our investment in Banco Inter and the commercial partnerships that we intend to build will be very accretive in terms of learning and new experiences.
We remain confident in our core business and excited with our future growth and opportunities. We will continue our efforts to be a protagonist in the financial and commerce revolution of our country, finding the best people we can and serving our client with maximum care and devotion.
Thank you for your support!”
Thiago Piau, CEO
2
Operating and Financial Highlights 1Q21
|
Total Payment Volume (TPV) R$ 51.01 BN Up 35.5% year over year, or R$50.8 billion excluding Coronavoucher, an increase of 34.9% |
Take Rate ex-Coronavoucher 1.63% Broadly in line with the fourth quarter, despite R$115.8 million impact from higher credit provisions and COVID-related financial incentives to clients; Reported Take Rate was 1.62% |
|
Total Revenue and Income R$867.7 MM An increase of 21.1% year over year, despite R$115.8 million impact from higher credit provisions and COVID-related financial incentives to clients |
Net Addition of Clients (ex-TON) 60,2002 leading to a Total Active Client base of 722,3002 (excluding TON). TON reached 190,300 clients in the quarter adding 76,600 in the period |
|
Adjusted Net Income R$ 187.4 MM Up 15.5% year over year, despite higher level of investments and revenue impacts from higher credit provisions and financial incentives to clients |
Adjusted EPS (diluted) R$ 0.60 per share An increase of 3.3% year over year |
|
Net Income R$ 158.3 MM In line year over year, with Net Margin of 18.2% |
EPS (basic) R$ 0.51 per share 10.7% lower year over year
|
1 From 1Q21 onwards, reported TPV figures consider all volumes processed and settled by StoneCo. As a result, in 1Q21 we have included volumes processed by Pagar.me PSP with acquirers other than Stone. This change added R$160 million to total TPV in the quarter, implying a 35.1% growth excluding those volumes, or 34.5% ex-Coronavoucher.
2 From 1Q21 onwards, reported Active Client Base includes clients from our PSP solution which were not previously included in our reported numbers. PSP clients that were included in our client base totaled 10,600 in 1Q21. Please refer to the reconciliation of historical numbers from previous and current metric on page 13.
3
1Q21 Key Highlights
In the first quarter of 2021, the second wave of the COVID-19 pandemic in Brazil resulted in different commerce restrictions among the many Brazilian cities, imposing a more challenging scenario for our clients and commerce as a whole. Despite this fact, when we look at (i) the recovery patterns from the first COVID wave last year, (ii) current data trends from our clients and (iii) the commerce dynamics in other countries where vaccination is more advanced, we believe that once vaccination scales in Brazil, commerce activity will normalize, and our country’s economic recovery will be fast.
Based on that and on the strength of our business, differently from last year, we have decided to keep increasing investments in growth, so we can be ready to take full advantage of economic recovery once commerce restrictions ease in Brazil. Some examples of investments we have made in the quarter are as follows:
| · | We continued to increase our distribution capacity, growing our salesforce headcount by 24% and our marketing investments by 33% quarter over quarter; |
| · | We increased our investments in technology and infrastructure to support the strong growth of our business ahead of us, growing our technology team by 20% compared to the previous quarter; and |
| · | We have expanded our client service operation, growing our customer service and logistics teams by 32% quarter over quarter. |
Our SMB business continues to grow fast and consistently. This quarter was marked by strong growth in the core and continued engagement in our platform, despite short term impacts from COVID-19:
| 1. | We continue to grow our base of clients among the different solutions that we offer. We added 62,400 SMB clients (ex-TON) in the quarter and increased TON’s client base by 76,600 clients. This represents a record net addition of 138,000 unique clients in the quarter. The number of clients active in our credit solution reached 102,300 (+15% q/q) and the number of active digital accounts reached 237,400 (+42% q/q), of which 188,400 already use the Stone Account as their main settlement account. |
| 2. | Combining our SMB operations (both Stone and Pagar.me) with our micromerchant solution under TON, our TPV grew 45.0% year over year, higher than the growth reported one year ago, and a similar level to the fourth quarter of 2020. We have seen a strong recovery in terms of volumes since the second COVID wave low in March, with TPV per client in our Stone SMBs in May/21 higher than in the beginning of the year and prior to the second wave. The 45% growth in TPV of our SMB+micro operations in the first quarter of 2021 has accelerated to 122% in April and 111% in May up to May 20th. Looking at a two-year CAGR to normalize the effect from a weaker 2020 April, we see accelerating growth in May, at a two-year CAGR of 50%, as shown below. |
| Chart 1: SMB3 + Micro TPV y/y growth | Chart 2: SMB + Micro TPV 2-Year CAGR |
 |
 |
3 Includes both Stone and Pagar.me SMBs.
4
| 3. | We continue to see higher traction of clients in our ABC Platform, with the percentage of Heavy Users (those who are active in payments, credit and banking at the same time) reaching 7.7% and the percentage of our payments SMB clients in the hubs that are active either in credit or banking reaching 41% in the first quarter of 2021, compared to 34% in the previous quarter. |
| 4. | In terms of financial results in our core SMB operation, we had a negative impact of R$115.8 million in the quarter due to R$109.7 million in higher provisions from our credit solution and R$6.1 million in temporary financial incentives to clients. This has resulted in a decrease in the take rate of our SMB operation from 2.20% in the first quarter of 2020 to 1.87% in the first quarter of 2021. Excluding these effects, we believe our SMB operation’s take rate would have been 2.22%. Higher provisions for expected delinquency in our credit operations were influenced by more commerce restrictions in Brazil in the first quarter of 2021 amid a second wave of COVID. Despite such higher provisions, our credit portfolio grew and remains healthy, reaching a risk-adjusted-return (“RAR”) net of funding costs between 1.5% and 1.9% on a monthly basis. Also, we continue to evolve in our strategy to fund our product with third-party capital and thus limit our exposure to credit risk. As of the second quarter of 2021, we have concluded another issuance of FIDC, raising R$ 340 million in third-party capital. In total, we currently have R$833 million in third-party funding available for our credit operation. |
In software, we have reached an active base of 133,000 clients in the first quarter of 2021, with pro-forma4 revenues in the quarter of R$55.2 million (+43% organically year over year). From the first quarter of 2021 onwards, we are excluding from our reported software client base our clients with reconciliation and loyalty solutions, which totaled 289,000 clients in the first quarter of 2021, as those solutions will be integrated into our ABC Platform and will be treated as an additional features. Considering how the Linx acquisition is expected to enhance our ecosystem, although still pending anti-trust approval, our overall client base considering Linx would be of 202,000 active clients and pro-forma revenues in the quarter would be R$286 million, or approximately R$1.1 billion on an annualized basis.
In Pagar.me Key Accounts business - Fintech-as-a-Service (“FaaS”), which serves larger clients who look to embed financial services in their offerings, we continue to see short term growth headwinds. TPV in the first quarter of 2021 increased by 21% to R$18.2 billion, while take rate has decreased from 1.10% in the first quarter of 2020 to 0.80% in the first quarter of 2021, a decrease of 30 basis points, mainly a result of lower prepayment rates. Take rate net of funding costs has decreased from 0.55% in the first quarter of 2020 to 0.45% in the first quarter of 2021 (-10 bps). Pagar.me key accounts business is usually a more volatile business and although TPV growth can vary, impact of such variations in our earnings is limited, given the lower margin profile of this part of the business.
Regarding our consolidated results, Total Revenue and Income was R$867.7 million, an increase of 21.1% compared to the first quarter of 2020 and our Adjusted Net Income was R$187.4 million, a 15.5% year over year growth. Consolidated TPV grew 35.5% to R$51.0 billion and consolidated take rate excluding Coronavoucher was 1.63%, 18 basis points lower than the first quarter of 2020.
In the following section, we will double click into our operational results and strategic evolution, providing an overview of our results in three different fronts:
| · | Financial Operating System for SMBs: includes our payments and financial services business serving bricks-and-mortar SMBs in the hubs, online clients in Pagar.me SMB business and micromerchants in TON. |
| · | Software: relates to our software ecosystem of POS/ERP in different verticals for merchants of all sizes as well as solutions to help our clients digitize. |
| · | Pagar.me Key Accounts -Fintech-as-a-Service (“FaaS”): operations in which Pagar.me acts as a fintech infrastructure for different players who look to embed financial services in their offerings, such as platforms, large omni-channel retailers, subacquirers and integrated software partners. |
4 Pro-forma numbers for software are calculated as if StoneCo had acquired 100% of the software companies in its portfolio, regardless of the stake acquired. StoneCo has made minority investments in some companies and has not yet exercised option to consolidate some of them. There is no assurance that StoneCo will exercise its option to consolidate any companies in which it has made a minority investment.
5
1Q21 Operational and Strategic Evolution
Financial Operating System for SMBs
Strategy Overview
The strong signs of traction and engagement of current users of our ABC Platform, coupled with commerce digitization trends, have encouraged us to continue evolving our solutions to create a unified Financial Operating System for SMBs, online and offline.
We have gotten to where we are today by developing different solution sets to help our SMB clients with their financial needs. We built the ABC Platform to help brick and mortar SMBs with an integrated payments, banking and working capital offering. We have already migrated approximately 70% of Stone SMB client base to this new platform. At the same time, we have enabled SMB clients to sell online through Pagar.me. More recently, we launched our TON solution for micromerchants. We have also acquired additional solutions to help our clients with value-added services, such as reconciliation (RaioX) and loyalty (Collact). From now on, when we refer to “SMBs” we will be referring to those three types of clients: Stone SMBs, Pagar.me SMBs and TON merchants.5
As we have achieved scale with those solutions, looking ahead, we have taken the challenge to integrate our solution set of Pagar.me SMB business and TON into the unified experience of the ABC Platform, which will become a complete financial operating system for SMBs that want to sell online and offline. Our plan is to also integrate in the ABC Platform some of our horizontal software solutions such as reconciliation and loyalty.
We will summarize the elements of this financial operating system in four feature sets: Money-In, Working Capital, Money-Out and Value-Added Services.
Through Money-In features we enable our clients to collect money from their sales in cards and other non-cash payment methods, such as PIX, wire transfers, boletos and vouchers. We are evolving to enable reconciliation of all payment methods and providers, as well as online sales, with risk management and chargeback disputes.
One of the most mission critical needs our clients have is Working Capital and we address those needs both through pre-payments and loans.
Once our clients cash-in their sales using our platform and can take Working Capital solutions to help them grow their business, we want to help them with a complete set of Money-Out features, such as bill, tax and boleto payments, wiretransfers, PIX and a card to pay other business-related expenses and withdraw cash. We are working hard to launch our payroll feature so our clients can pay their employees in a simple way.
As our solution evolves, we will offer value-added services integrated to our core platform such as loyalty and CRM.
5 We have presented a Glossary of Terms on page 32 for reference
6
Operational Results
Overall, Active Client Base from our SMB Operations increased 67% year over year to reach 857,800 in the first quarter of 2021, with quarterly net adds at 138,000 in the quarter. From those, (i) 62,400 are coming from Stone and Pagar.me SMBs, a slightly lower addition of clients compared to 64,900 in the previous quarter, despite COVID-19 commerce restrictions, and (ii) 76,600 are coming from TON, a strong acceleration compared to 48,800 in the fourth quarter of 2020.
| Chart 3: SMB Active Payment Client Base (‘000)6 | Chart 4: SMB Payments Quarterly Net Adds (‘000) |
 |
 |
The number of Open Digital Banking Accounts increased to 658,100, 1.3 times the level in the fourth quarter of 2020 and 5.4 times the first quarter of 2020. The number of Active Digital Banking Account reached 237,400 and implies an increased account activation both compared to the first and the fourth quarter of 2020, and with 188,400 clients using Stone as their main settlement account in our payments business. Going forward, we will report our Active Digital Banking Account only.
| Chart 5: Banking Number of Open Accounts (‘000) | Chart 6: Banking Number of Active Accounts (‘000) |
 |
 |
Below we highlight the evolution of engagement in Money-In, Working Capital and Money Out features:
| · | Money-in: TPV for SMBs grew 45% year over year, reaching R$32.8 billion in the quarter. The total volume of Banking Money-In transactions reached R$2.6 billion, 4.6 times the prior year period. Finally, the total accounts balance from our SMBs grew five-fold year over year to reach R$614.5 million in the first quarter of 2021. We will continue working to enable our clients to accept all forms of payments available in the market. |
| · | Working Capital: We have continued to provide our SMB clients with prepayment options, having increased the percentage of clients with prepayment to 67% from 62% one year ago and the total prepaid volume by 38% year over year despite stronger debit volumes on a year over year basis. |
On credit, we have been improving our credit scoring model and given the volatility in commerce activity as a result of the pandemic, we have decided to increase provisions for expected losses, which has impacted negatively our results in the first quarter of 2021. Despite that, we believe the COVID
6 Excludes overlap between SMBs and Micromerchants.
7
crisis has demonstrated the resiliency of our credit business, as we continue to see our portfolio risk-adjusted return (RAR) between 2.1% and 2.5% per month and RAR net of Cost of Funds between 1.5% and 1.9% per month, with average weighted life of 9 months and improving cohorts of clients to date. The number of clients with credit increased to 102,300 from 88,900 in the previous quarter, with credit portfolio increasing to R$1,901 million from R$1,514 million in the fourth quarter of 2020. Also, the proportion of our portfolio being funded with third-party capital has increased from approximately 4% in the fourth quarter of 2020 to approximately 17% in the first quarter of 2021, in line with our strategy to reduce our credit exposure. On May 28, 2021, we have concluded an additional funding raise of R$400 million through a FIDC, of which R$340 million is being funded by third-party capital (85% of total) and R$60 million being funded by our own capital. Overall, we currently have R$833 million of third-party capital to fund our credit operations.
| Chart 7: Credit Number of Clients (‘000) | Chart 8: Credit Portfolio (R$mm) |
 |
 |
| · | Money-out: Banking Money-Out Volumes have reached R$8.9 billion in the quarter, 5.7 times the level seen in the first quarter of 2020. At the same time, while still at its early stages, our Prepaid Card usage has been gaining traction, with R$218.8 million in TPV in the first quarter of 2021, compared to R$44.9 million in the prior-year period. |
Software
Strategy Overview
In software, we have taken several steps in the direction of helping merchants of all sizes with their workflow tools, to drive their digitization and growth. We have invested in and acquired POS and ERP software businesses with two main opportunities for value creation: (i) to upsell financial services, and (ii) select segments where we could help drive the digitization of commerce.
We have invested in POS/ERP software businesses in verticals such as retail, services and food, in digital solutions such as media tools and food delivery as well as reconciliation and TEF (brick and mortar gateway). The acquisition of Linx (which is still pending anti-trust approval) is expected to be a big step forward and will broaden our vertical strategy by adding fashion, automotive, drugstores and gas stations, as well as expand our digital and cross vertical solutions set.
Our strategy in POS/ERP solutions will continue to be driven by (i) expanding presence in strategic verticals through M&A and (ii) continuing to support organic growth within each vertical.
In addition to our ecosystem of POS and ERP solutions, with Linx we will enhance our presence in digital, by helping large brick and mortar merchants to go omnichannel through Linx’s OMS, as well as SMB and mid/large retailers to sell directly to their consumers through eCommerce platform, marketplace gateway and food delivery apps.
8
In order to further drive digital presence and sales, we help our SMB clients engage with social media and we expect to expand the offering of engagement tools through Linx Impulse, helping merchants better attract new customers.
Through the combination of digital tools and the relevant presence we will establish through our vertical strategy, we will seek to connect the inventory of our software clients with consumer facing businesses, such as the new commercial partnership we are discussing with Banco Inter, highlighted in our press release on May 24, 2021.
Operational Results
We have continued to see strong evolution in the number of subscribed software clients, which grew to 133,000 in the first quarter of 2021, 4.0 times the number of clients in the first quarter of 2020. From the first quarter of 2021 onwards, we are excluding from our reported software client base our clients with reconciliation and loyalty solutions, which totaled 289,000 clients in the first quarter of 2021, as those solutions will be integrated into our ABC Platform and will be treated as an additional feature.
Chart 9: Number of Subscribed Software Clients (‘000)
(excludes Raio-X and Collact)

Pro-forma revenue of our software solutions7 grew by 43% organically year over year in the first quarter of 2021 to R$55.2 million, with an annualized run rate of approximately R$221 million. Considering Linx total net revenue, annualized pro-forma revenue will be approximately R$1.1 billion.
Below we provide some additional details on the performance of StoneCo and Linx8 software solutions:
| · | POS/ERP: Regarding solutions to SMBs, the number of clients has increased 12% to 26,800 and pro-forma revenue has increased by 26% to R$6.6 million. If we add Linx´s results9 for SMBs, number of clients would have increased to 47,900 (+13%) and pro-forma revenue would have increased by 30% to R$10.3 million. Regarding solutions to mid-large clients, the number of clients has increased 6% to 7,000 and pro-forma revenue has increased by 14% to R$7.5 million. If we add Linx´s numbers10, number of clients would have reached 46,600 and pro-forma revenue would have reached R$164.4 million (+9% year over year). |
7 Pro-forma numbers for software are calculated as if StoneCo had acquired 100% of the software companies in its portfolio, regardless of the stake acquired. StoneCo has made minority investments in some companies and has not yet exercised option to consolidate some of them. There is no assurance that StoneCo will exercise its option to consolidate any companies in which it has made a minority investment.
8 Linx number according to the company´s public filings of 1Q21 results.
9 Linx transaction is still pending antitrust approval and is not yet closed. Therefore, our reported financials do not yet incorporate any number from Linx.
10 Refers to Core Big Retail & Napse and Core Mid & Large.
9
| · | Digital solutions: |
Regarding digital commerce, we expect to enhance our ecosystem when our acquisition of Linx is closed, with Linx Commerce and OMS products. Linx has reported an increase of approximately 100% in total GMV (Linx Commerce + OMS) to R$1.3 billion in the first quarter of 2021, a 24% increase in the number of clients to approximately 3,500 and a 97% increase in recurring revenue.
In digital solutions for food, we have seen our GMV increase 2.1 times to R$128.8 million, our number of clients increase by 62% to 11,100 and pro-forma revenue increase 3.7 times to R$8.3 million. If we add Linx´s results for food apps, GMV would have increased by 2.7 times to R$349.2 million, number of clients would have increased to 15,300 (+74%) and pro-forma revenue would have increased by 3.8 times to R$12.4 million.
In engagement tools, our number of clients has increased by 70% to 73,100 and our pro-forma revenue has increased by 66% to R$6.6 million. If we add Linx´s public numbers7 for Linx Impulse, number of clients would have increased to 73,700 (+69%) and pro-forma revenue would have increased by 43% to R$27.3 million.
| · | Reconciliation, TEF and others: We have seen total number of clients relatively stable compared to the first quarter of 2020 at 15,800 and pro-forma revenue increase by 28% to R$26.2 million. |
Pagar.me Key Accounts - Fintech-as-a-service (“FaaS”)
When looking at the performance of Pagar.me key accounts, which comprises all clients who wish to embed payments, such as platforms, integrated software partners, subacquirers and large merchants, we continue to see short term headwinds in TPV growth and revenues and expect this trend to continue in the short term. Although we will continue to evolve our Pagar.me key account offering to a broader set of features, such as banking-as-a-service (“BaaS”) and credit-as-a-service (“CaaS”), Pagar.me focus will be inclined towards digital native SMBs and the integration with the ABC platform. That said, we remind that key accounts are a more volatile business and the representativeness to our earnings is very small, despite being more relevant in TPV.
In the first quarter of 2021, TPV in Pagar.me key accounts increased by 21% to R$ 18.2 billion, decelerating from growth in previous quarters due to the combination of tougher comps in the first quarter of 2020 and a lower share of wallet in some of our largest clients, who still concentrate a relevant portion of TPV. In the second quarter to date, up to May 20th, 2021, TPV of Pagar.me key accounts has increased by 26% year over year.
Take rate of Pagar.me key accounts has decreased from 1.10% in the first quarter of 2020 to 0.80% in the first quarter of 2021, a decrease of 30 basis points, mainly a result of lower prepayment rates, which were impacted by lower CDI rates in Brazil. Take rate net of funding costs has decreased from 0.55% in the first quarter of 2020 to 0.45% in the first quarter of 2021 (-10 bps).
The weaker growth in larger clients TPV combined with the effects from the lower CDI rates year over year weighing on prepayment prices for those clients resulted in revenue of Pagar.me key accounts continuing to decrease on a year over year basis.
10
Outlook
The outlook below constitutes forward-looking information within the meaning of applicable securities laws and is based on a number of assumptions and subject to a number of risks. Actual results could vary materially as a result of numerous factors, including certain risk factors, many of which are beyond StoneCo´s control. Please see "Forward-looking Statements" below.
Our outlook assumes the continuation of growth trends in our industry, our ability to manage our growth effectively, the absence of material changes in our industry and economy. Our outlook assumes that Brazil continues to roll out vaccines in 2021 and population is able to move about more freely and that the overall economic environment will likely improve.
The following statements supersede all prior statements made by StoneCo and are based on current expectations. As these statements are forward-looking, actual results may differ materially.
These statements do not factor in the Linx acquisition, which is still pending regulatory approval and has not yet closed.
In view of these factors, we expect the following:
For 2021:
| · | We expect to report between 1.4 million and 1.5 million active clients in payments, including TON; |
| · | Total Active Payment Clients excluding TON of approximately 950,000; |
| · | Take Rate (ex-Coronavoucher) between 1.85% and 2.00% for the full year; |
| · | Total Revenue and Income is expected to have significant acceleration from 2020 growth level. |
11
 | Operating and Financial Metrics |
Table 1: Operating and Financial Metrics 11 12 13 14
| Main Operating and Financial Metrics | 1Q21 | 1Q20 | Δ | |
| Consolidated Metrics | ||||
| TPV (R$ billions) | 51.0 | 37.6 | 35.5% | |
| Active Payment Clients (ex-TON) (thousands) 11 | 722.3 | 537.0 | 34.5% | |
| Period Net Additions (ex-TON) (thousands) 11 | 60.2 | 51.5 | 16.8% | |
| TON Active Clients 12 | 190.3 | 23.2 | 718.6% | |
| Take Rate | 1.62% | 1.81% | (0.18 p.p.) | |
| Total Revenue and Income (R$ millions) | 867.7 | 716.8 | 21.1% | |
| Adjusted Net Income (R$ millions) | 187.4 | 162.3 | 15.5% | |
| Adjusted diluted EPS | 0.60 | 0.58 | 3.3% | |
| Financial Operating System for SMBs13 | ||||
| Active Clients (thousands) | 857.8 | 514.7 | 66.6% | |
| Period Net Additions (thousands) | 138.0 | 53.0 | 160.3% | |
| Digital Active Banking Account (thousands) | 237 | 42 | 464.5% | |
| Credit Clients (thousands) | 102.3 | 30.9 | 231.0% | |
| Take Rate | 1.87% | 2.20% | (0.33 p.p.) | |
| Money In | ||||
| TPV (R$ billions) | 32.8 | 22.6 | 45.0% | |
| Banking Money-In Volumes (R$ billions) | 2.6 | 0.6 | 357.2% | |
| Total Accounts Balance (R$ millions) | 614.5 | 122.6 | 401.2% | |
| Money Out | ||||
| Prepaid Card TPV (R$ millions) | 218.8 | 44.9 | 386.9% | |
| Banking Money-Out Volumes (R$ billions) | 8.9 | 1.5 | 472.0% | |
| Working Capital | ||||
| Credit Portfolio (R$ millions) | 1,900.6 | 331.8 | 472.8% | |
| Pagar.me Fintech-as-a-Service | ||||
| TPV (R$ billions) | 18.2 | 15.0 | 21.1% | |
| Take Rate | 0.80% | 1.10% | (0.30 p.p.) | |
| Software | ||||
| Subscribed Clients (thousands)14 | 133 | 33 | 304.7% |
11Active clients mean clients that have transacted at least once over the preceding 90 days.
12 For clients of TON, Active Clients mean clients that have transacted with TON or Stone Mais solution at least once over the last 12 months.
13 Includes Stone brick-and-mortar operations in the hubs, online operations of Pagar.me SMB business and TON.
14 Excludes RaioX (reconciliation) and Collact (CRM/Loyalty).
12
Active payments client base
From this quarter onwards, we are
starting to include clients from our Pagar.me PSP solution in our reported numbers. Those clients were not previously included in our Active Client Base numbers. As a result, we are providing below the historical
reconciliation of our active client base in the way we reported up until the fourth quarter of 2020 and from the first quarter of 2021
onwards.
| Chart 10: Payments Active Client Base – Previous (‘000) | Chart 11: Payments Active Client Base - Current (‘000) |
| (Excludes TON/Stone Mais)15 (‘000) | (Excludes TON/Stone Mais)16 |
 |
 |
In the first quarter of 2021, we reached an active client base of 722,30016 (excluding TON), or a 34.5% growth year over year. This represents a net addition of clients of 60,200 in the quarter and with growth in every Brazilian State, despite the second wave of COVID-19, with different commerce restrictions among Brazilian cities. Our SMB business contributed with 62,400 net addition of clients in the quarter, while our Pagar.me key accounts business presented a net reduction of 2,000 clients in the quarter.
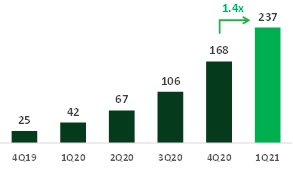
Client base in TON17 reached 190,300 clients in the first quarter of 2021, 67% growth quarter over quarter, adding 76,600 clients in the period.
Chart 12: TON Active Client Base (‘000)

15 Active clients mean clients that have transacted at least once over the preceding 90 days.
16 Excludes TON clients.
17 For clients of TON, Active Clients mean clients that have transacted with TON or Stone Mais solution at least once over the last 12 months.
13
Take Rate
Our reported Take Rate was 1.62% in the first quarter of 2021, 13bps higher than the fourth quarter of 2020, mostly as a result of lower Coronavoucher volumes in the quarter, which are debit-like transactions and have lower Take Rate. Excluding the effect from Coronavoucher, our Take Rate was 1.63%, broadly in line with the previous quarter’s 1.64%, despite R$115.8 million from higher provisions for our credit solution and COVID-related financial incentives given to clients.
Take Rate excluding Coronavoucher
volumes was 18bps lower than in the first quarter of 2020, mainly explained by lower prepayment prices on a year over year basis, with
strong contribution from the lower base rate in the country year over year affecting especially key accounts, and by higher credit provisions
in the first quarter of 2021, which had a negative impact in our Take Rate.
Chart 13: Evolution of Take Rate18

18 According to IFRS 15, subscription revenue is accounted for over the expected life of merchants on a linear basis. As part of the annual assessment of assumptions for linearization of subscription revenue, life of merchants was revised upwards in 3Q19, contributing positively 3 bps to 3Q19 take rate of 1.91% compared with 2Q19.
14
TPV
Total Payment Volume (TPV) was R$51.019 billion, up 35.5% year over year in the first quarter of 2021 compared with the prior year period. Excluding Coronavoucher20 volumes, which amounted to R$0.2 billion in the quarter, TPV grew 34.9% year over year.
Despite COVID-19, we were able to report strong TPV growth among SMBs21 – both in Stone, Pagar.me SMBs and TON – with 45% year over year growth in the quarter, above the first quarter of 2020 40% growth and close to the 47% fourth quarter of 2020 growth. Pagar.me key accounts22 business continues weighing on total TPV growth, with decelerating growth in the quarter as a consequence of lower share of wallet in our larger clients due to their more volatile nature and tougher first quarter of 2020 comps.
Table 2: Quarterly Statement of Profit or Loss
| Statement of Profit or Loss (R$mm) | 1Q21 | % Rev. | 1Q20 | % Rev. | Δ % | Δ p.p. | |
| Net revenue from transaction activities and other services | 318.3 | 36.7% | 227.3 | 31.7% | 40.0% | 5.0 p.p. | |
| Net revenue from subscription services and equipment rental | 139.9 | 16.1% | 93.1 | 13.0% | 50.3% | 3.1 p.p. | |
| Financial income | 368.8 | 42.5% | 359.3 | 50.1% | 2.6% | (7.6 p.p.) | |
| Other financial income | 40.6 | 4.7% | 37.0 | 5.2% | 9.8% | (0.5 p.p.) | |
| Total revenue and income | 867.7 | 100.0% | 716.8 | 100.0% | 21.1% | 0.0 p.p. | |
| Cost of services | (239.7) | (27.6%) | (149.9) | (20.9%) | 59.8% | (6.7 p.p.) | |
| Administrative expenses | (117.6) | (13.6%) | (73.9) | (10.3%) | 59.0% | (3.2 p.p.) | |
| Selling expenses | (162.8) | (18.8%) | (111.8) | (15.6%) | 45.5% | (3.2 p.p.) | |
| Financial expenses, net | (92.5) | (10.7%) | (148.4) | (20.7%) | (37.7%) | 10.0 p.p. | |
| Other operating expenses, net | (41.5) | (4.8%) | (3.5) | (0.5%) | 1090.3% | (4.3 p.p.) | |
| Loss on investment in associates | (3.6) | (0.4%) | (1.3) | (0.2%) | 182.0% | (0.2 p.p.) | |
| Profit before income taxes | 210.0 | 24.2% | 227.9 | 31.8% | (7.9%) | (7.6 p.p.) | |
| Income tax and social contribution | (51.7) | (6.0%) | (69.3) | (9.7%) | (25.4%) | 3.7 p.p. | |
| Net income for the period | 158.3 | 18.2% | 158.6 | 22.1% | (0.2%) | (3.9 p.p.) | |
| Adjusted Net Income | 187.4 | 21.6% | 162.3 | 22.6% | 15.5% | (1.0 p.p.) |
19 From 1Q21 onwards, reported TPV figures consider all volumes processed and settled by StoneCo. As a result, in 1Q21 we have included volumes processed by Pagar.me PSP with acquirers other than Stone. This change added R$160mm to total TPV in the quarter, implying a 35.1% growth excluding those volumes, or 34.5% ex-Coronavoucher.
20 Coronavoucher is a government financial aid program targeting the most vulnerable part of the population as autonomous and informal workers and people without income. Those individuals receive the amounts in a prepaid card and many of them used the card to transfer money to different digital wallets and to buy goods. Whenever those digital wallets use Stone fintech-as-a service platform to process the cash-in transactions, we capture the related TPV.
21 Includes SMBs at Stone, online SMBs at Pagar.me and micromerchants in TON.
22 Refers to Pagar.me key accounts business, excluding Pagar.me online SMB business.
15
Total Revenue and Income
Total Revenue and Income was R$867.7 million in the first quarter of 2021, an increase of 21.1% from R$716.8 million in the first quarter of 2020. Excluding Other Financial Income, which is mainly comprised of interest on cash, our Total Revenue and Income grew 21.7% to R$827.0 million in the first quarter of 2021.
Total Revenue and Income growth was driven primarily by the 35.5% increase in TPV, partially offset by the lower Take Rate year over year.
Revenue in SMBs23 grew less in the first quarter of 2021 compared to the previous quarter as a result of the recognition of higher provisions for delinquencies in our credit solution and the aid given to our clients in the form of financial incentives amid COVID-19, which together, totaled a negative revenue impact of R$115.8 million.
In Pagar.me24 key accounts, we saw revenues down year over year, mainly due to the lower base rate, which directly impacted prepayment prices from our large clients, in line with the previous quarter dynamics.
Chart 14: Total Revenue and Income in the Quarter (R$mm)

Net Revenue from Transaction Activities and Other Services
Net Revenue from Transaction Activities and Other Services was R$318.3 million in the first quarter of 2021, an increase of 40.0%, compared with the first quarter of 2020. This increase was mostly due to the R$13.4 billion growth in TPV year over year combined with a higher Transaction Activities and Other Services take rate as a result of a stronger mix towards SMBs25 compared to Pagar.me key accounts.
Net Revenue from Subscription Services and Equipment Rental
Net Revenue from Subscription Services and Equipment Rental was R$139.9 million in the first quarter of 2021, 50.3% higher than the first quarter of 2020. This increase was primarily due to a higher active client base combined with contribution from our software solutions and partially compensated by lower POS average subscription per client, which is mainly a result of additional new-client subscription incentives, including COVID-related financial incentives.
23 Includes SMBs at Stone, online SMBs at Pagar.me and micromerchants in TON.
24 Refers to Pagar.me key accounts business, excluding Pagar.me online SMB business.
25 Includes SMBs at Stone, online SMBs at Pagar.me and micromerchants in TON.
16
Financial Income
Financial Income was R$368.8 million in the first quarter of 2021, an increase of 2.6% year over year, primarily due to higher prepayment volumes. Financial Income was negatively affected by higher provisions for delinquencies in our credit solution amid COVID-19 in the quarter, as previously stated.
Revenue from our credit solution is accounted for at fair value and factors in expected delinquency rates.
Other Financial Income
Other Financial Income was R$40.6 million in the first quarter of 2021, an increase of 9.8% compared to the first quarter of 2020. This increase was mainly due to the Company’s higher cash balance position as a result of the follow on offering in August, 2020 amounting to USD1.5 billion, which more than compensated the lower base rate in the country year over year.
17
Costs and Expenses
Despite the second wave of COVID-19 in the first quarter of 2021, we took the decision to increase investments in our business in order to be ready to accelerate growth once Brazilian economy comes back to normal levels.
Chart 15: Operating Leverage26

Operating Costs and Expenses as a percentage of Total Revenue and Income were 59.9%, 12.5 percentage points higher than the fourth quarter of 2020. This quarter over quarter increase is mostly explained by operating deleverage as a result of revenue impact from higher provisions for delinquencies in our credit solution and COVID-related financial incentives to help clients withstand the second wave of the pandemic. These direct effects were responsible for 8.9 percentage points loss on pre-tax margins quarter over quarter. Also, COVID-19 commerce restrictions impacted our clients’ TPV, which also contributed to our operating deleverage, but is not included in the number just mentioned.
In addition, we continued to invest in our operations, even amid COVID, with investments affecting our pre-tax margins by 5.1 percentage points, which includes (i) the hiring of salespeople, customer support personnel and logistics agents, (ii) higher marketing investments for both TON and Stone, (iii) investments in technology and (iv) investments in new solutions such as TON, software companies and banking, which currently have a negative contribution to our bottom line.
26 Includes Cost of Services, Administrative Expenses and Selling Expenses as a percentage of Total Revenue and Income. Quarterly unaudited data.
18
Costs and Expenses
Cost of Services
Cost of Services were R$239.7 million or 27.6% of Total Revenue and Income in the first quarter of 2021, an increase of 6.7 percentage points over the first quarter of 2020. This increase was mainly due to (i) higher investments in our technology and customer support teams, (ii) costs associated with our software solutions, (iii) higher datacenter costs to support our operation and (iv) the increase in the unit cost of chargebacks.
Compared to the fourth quarter of
2020, Cost of Services as a percentage of Total Revenue and Income increased 6.3 percentage points to 27.6% from 21.3%, mainly because
of (i) operational deleverage as a result of the revenue impact from higher credit provisions and COVID-related financial incentives
to clients, (ii) higher investments in new solutions, including TAG (registry of receivables business) and banking services costs related
to the ABC Platform, (iii) higher brand fees related to the increase in the unit cost of chargebacks (iv) higher POS depreciation, mainly
in TON, as a result of the significant increase in its client base and (v) higher investments in our customer support team.
Administrative Expenses
Administrative Expenses were R$117.6 million, or 13.6% of Total Revenue and Income, 3.2 percentage points higher than the prior year-period, mainly due to expenses associated with our software portfolio companies, as we continue to make new investments.
Compared with the fourth quarter of
2020, Administrative Expenses increased from 12.2% of Total Revenue and Income to 13.6%, mainly due to the revenue impact from higher
credit provisions and COVID-related financial incentives to clients.
Selling Expenses
Selling Expenses were R$162.8 million in the quarter, or 18.8% of Total Revenue and Income, 3.2 percentage points higher than in the prior year period, mostly explained by higher marketing investments, mainly in TON.
Compared with the fourth quarter of
2020, Selling Expenses as a percentage of revenues increased 4.8 percentage points, mostly explained by (i) operational deleverage as
a result of the revenue impact from higher credit provisions and COVID-related financial incentives to clients, (ii) investments in hiring
of salespeople and (iii) higher overall marketing expenses, especially in TON.
Financial Expenses, Net
Financial Expenses, Net were R$92.5 million, a decrease of 37.7%, compared with the first quarter of 2020, mainly explained by lower cost of funds due to the lower base rate and higher use of own cash to fund the prepayment operation, which more than compensated the higher volumes in the quarter.
Compared with the previous quarter, Financial Expenses, net as a percentage of Total Revenue and Income increased from 6.4% to 10.7%, mainly explained by (i) operational deleverage as a result of the revenue impact from higher credit provisions and COVID-related financial incentives to clients, (ii) higher cost of funds explained by a higher base rate in the country and (iii) mark-to-market of short-term investments.
19
Costs and Expenses
Other Operating Expenses, Net
Other Operating Expenses, Net were R$41.5 million in the first quarter of 2021, compared with R$3.5 million in the first quarter of 2020. This difference is mainly related to (i) an unusually low share-based expense in the first quarter of 2020 related to lower tax and social charges provisions due to high depreciation of our shares in that quarter and (ii) fair value adjustments of call options related to affiliates, labor contingencies and tax claims which together impacted other operating expenses in the first quarter of 2021.
Compared with the fourth quarter of 2020, Other Operating Expenses, net were 54.0% lower or 4.2 percentage points lower as a percentage of Total Revenue and Income. This lower figure is mostly related to fourth quarter of 2020 events that did not repeat, including (i) the higher share-based expense in the fourth quarter of 2020 related to the tax and social charges provisions in relation to the appreciation of shares in the quarter, (ii) the R$10 million donation to help with the construction of a factory for the production of COVID-19 vaccines and (iii) higher than usual POS losses as a result of COVID-19 impact on SMBs.
Profit Before Income Taxes
Profit Before Income Taxes was R$210.0 million, or 7.9% lower year over year, with a pre-tax margin of 24.2% compared with 31.8% in the first quarter of 2020. This lower margin is mainly a result of the combination of (i) the revenue impact from higher credit provisions and COVID-related financial incentives to clients and (ii) higher investments in our operation, as described above, which impacts mainly our Cost of Services and Selling Expenses; (iii) Administrative expenses and Other Operating Expenses, net as a percentage of Total Revenue and Income. Those effects were partially compensated by lower Financial Expenses, net as a percentage of Total Revenue and Income as a result of the lower base rate year over year and higher use of own cash to fund the prepayment operation.
Compared with the fourth quarter of 2020, pre-tax margin was 12.6 percentage points lower explained mostly by (i) the revenue impact from higher credit provisions and COVID-related financial incentives to clients and (ii) higher investments in our operation in the first quarter of 2021 compared to the fourth quarter of 2020.
Income Tax and Social Contribution
During the first quarter of 2021, the Company incurred R$51.7 million in Income Tax and Social Contribution expenses, or a 24.6% effective tax rate, compared with a 30.4% tax rate in the first quarter of 2020 and a 16.9% effective tax rate in the fourth quarter of 2020.
20
Net Income and EPS
Adjusted Net Income was R$187.4 million in the first quarter of 2021, with a margin of 21.6%, compared with R$162.3 million Adjusted Net Income and a margin of 22.6% in the first quarter of 2020.
| Chart 16: Adjusted Net Income in the Quarter (R$mm) | Chart 17: Adjusted Net Margin in the Quarter |
 |
 |
Net Income was R$158.3 million in the first quarter of 2021, compared with Net Income of R$158.6 million in the first quarter of 2020. Net Margin decreased by 3.9 percentage points to 18.2% year over year in the first quarter of 2021. This reduction is mainly explained by the same factors mentioned above for the variation in Profit Before Income Taxes combined with a lower effective tax rate.
Adjusted diluted EPS for the Company was R$0.60 per share in the first quarter of 2021, 3.3% higher than in the first quarter of 2020, mostly explained by the 15.5% higher Adjusted Net Income, partially compensated by a higher average diluted number of shares. GAAP basic EPS was R$0.51 per share, a decrease of 10.7% year over year, mostly explained by a flattish Net Income, partially offset by a higher average basic number of shares.
21
Table 3: Adjusted Net Income Reconciliation (Quarter)
| Net Income Bridge (R$mm) | 1Q21 | % Rev. | 1Q20 | % Rev. | Δ % | Δ p.p. | |
| Net income for the period | 158.3 | 18.2% | 158.6 | 22.1% | (0.2%) | (3.9 p.p.) | |
| Share-based compensation expenses (a) | 20.7 | 2.4% | 2.1 | 0.3% | 905.6% | 2.1 p.p. | |
| Amortization of fair value adjustment (b) | 6.9 | 0.8% | 3.4 | 0.5% | 102.1% | 0.3 p.p. | |
| Gain on previously held interest in associate (c) | 0.0 | 0.0% | 0.0 | 0.0% | n.a. | 0.0 p.p. | |
| Other expenses (d) | 10.0 | 1.2% | 0.0 | 0.0% | n.a. | 1.2 p.p. | |
| Tax effect on adjustments | (8.5) | (1.0%) | (1.8) | (0.3%) | 363.1% | (0.7 p.p.) | |
| Adjusted net income | 187.4 | 21.6% | 162.3 | 22.6% | 15.5% | (1.0 p.p.) | |
| GAAP basic EPS (e) | 0.51 | n.a. | 0.57 | n.a. | (10.7%) | n.a. | |
| Adjusted diluted EPS (f) | 0.60 | n.a. | 0.58 | n.a. | 3.3% | n.a. | |
| Basic Number of shares | 309.6 | n.a. | 277.4 | n.a. | 11.6% | n.a. | |
| Diluted Number of shares | 314.8 | n.a. | 281.8 | n.a. | 11.7% | n.a. |
(a) Consists of expenses related to the vesting of one-time pre-IPO pool of share-based compensation.
(b) On intangibles related to acquisitions. Consists of expenses resulting from the amortization of the fair value adjustment on intangible assets and property and equipment as a result of the application of the acquisition method, a significant portion of which relates to the EdB and Equals acquisitions.
(c) Consists of the gain on re-measurement of our previously held equity interest in Linked to fair value upon the date control was acquired.
(d) Consists of the fair value adjustment related to associates call option, M&A expenses and earn-out interests related to acquisitions.
(e) Calculated as Net income attributable to owners of the parent (Net Income reduced by Net Income attributable to Non-Controlling interest) divided by basic number of shares. For more details on calculation, please refer to Note 17 of our Interim Condensed Consolidated Financial Statements, March 31st, 2021.
(f) Calculated as Adjusted Net income attributable to owners of the parent (Adjusted Net Income reduced by Net Income attributable to Non-Controlling interest) divided by diluted number of shares. Adjustments consider share-based compensation expenses and amortization of fair value adjustments, in line with previous disclosures.
22
Cash Flow
Because of the nature of the prepayment and credit businesses, the dynamics of the sale of receivables and the dynamics of the sale of credit outstanding balance to third-party investors, StoneCo management looks at Adjusted Net Cash Provided by/ (Used in) Operating Activities and Adjusted Net Cash Provided by/ (Used in) Financing Activities, both non-IFRS metrics. These metrics consist of transferring the following four working capital items27 from our operating cash flow to our financing cash flow: (i) changes in Accounts Payable to Clients; (ii) changes in Accounts Receivables from Card Issuers; (iii) Interest Income Received, Net of Costs28, which is shown separately in our Cash Flow Statement but is directly linked to the funding of our prepayment operation and (iv) Loans Designated at FVPL related to our credit operation (see Appendix "Notes on Cash Flows" in our 2020 Earnings Release for further details).
The table below is a summarized version of our Statement of Cash Flows and Adjusted Free Cash Flow (a non-IFRS metric), along with a reconciliation of these metrics with our managerial (non-IFRS) view of them, as well as reconciliation of Adjusted Net Cash Provided by/ (Used in) Operating Activities and Adjusted Net Cash Provided by/ (Used in) Financing Activities to Net Cash Provided by/ (Used in) Operating Activities and Net Cash Provided by/ (Used in) Financing Activities.
Table 4: Summarized Statement of Cash Flows and Free Cash Flow
| Summarized
Statement of Cash Flows (R$mm) |
1Q21 | 1Q20 | ||||||
| IFRS | (+)
Adjustments |
Managerial
(Non-IFRS) |
IFRS | (+)
Adjustments |
Managerial
(Non-IFRS) | |||
| Net Income | 158.3 | 158.3 | 158.6 | 158.6 | ||||
| (+) Adjustments to Net Income | 108.7 | 108.7 | 138.5 | 138.5 | ||||
| (+) Working capital adjustments | (356.2) | 165.9 | (190.3) | 65.3 | (372.6) | (307.3) | ||
| (+) AR, AP, interest income received, net of costs (a) | 181.1 | (181.1) | 0.0 | 556.4 | (556.4) | 0.0 | ||
| (+) Changes in Loans Designated at FVPL | (347.0) | 347.0 | 0.0 | (183.8) | 183.8 | 0.0 | ||
| (+) Other working capital changes | (190.3) | (190.3) | (307.3) | (307.3) | ||||
| (=) Cash provided by (used in) operating activities | (89.2) | 76.8 | 362.5 | (10.1) | ||||
| (-) Capex (b) | (376.5) | (376.5) | (112.2) | (112.2) | ||||
| (+) Other investing activities | (249.3) | (249.3) | 606.6 | 606.6 | ||||
| (=) Cash provided by (used in) investing activities | (625.9) | (625.9) | 494.5 | 494.5 | ||||
| (+) Debt/FIDC issuance (repayment) | 154.9 | 154.9 | (487.1) | (487.1) | ||||
| (+) Working capital related to credit operation | (347.0) | (347.0) | (183.8) | (183.8) | ||||
| (+) Working capital related to AR/AP | 181.1 | 181.1 | 556.4 | 556.4 | ||||
| (+) Capital events (c) | (0.9) | (0.9) | 182.8 | 182.8 | ||||
| (=) Cash provided by (used in) financing activities | 153.9 | (12.0) | (304.4) | 68.2 | ||||
| (+) Effect of foreign exchange on cash and cash equivalents | (22.4) | (22.4) | (2.3) | (2.3) | ||||
| (=) Change in cash and cash equivalents | (583.5) | (583.5) | 550.3 | 550.3 | ||||
| Free Cash Flow (R$mm) | 1Q21 | 1Q20 | ||||||
| Cash provided by (used in) operating activities | (89.2) | 165.9 | 76.8 | 362.5 | (372.6) | (10.1) | ||
| (-) Capex (b) | (376.5) | (376.5) | (112.2) | (112.2) | ||||
| Free Cash Flow | (465.7) | (299.8) | 250.3 | (122.3) | ||||
(a) Includes changes in accounts receivables from card issuers, accounts payable to clients and interest income received, net of costs .
27 Each “Accounts Payable to Clients” recognized as a liability on our balance sheet is directly linked to an “Accounts Receivable from Card Issuers” recognized as an asset in our balance sheet. The Company receives payment from issuing banks first, and only then pays its clients, thus having no working capital requirement. When a client opts to be paid early (prepayment), the Company has a working capital requirement. However, the Company has the option to sell the receivables related to those payables from card issuers in order to meet such working capital requirements. The combined effect to the cash flow is a positive operational cash flow equivalent to net fees earned by providing such prepayment service. Whenever management opts to fund its prepayment operation with sources other than the sale of its own receivables, Net Cash Provided by/ (Used in) Operating Activities may be affected, as discussed in “Note on the impact of different funding sources for prepayment in the financial statements” in the appendix of our 2020 Earnings Release. However, management does not view such decision as translating into higher or lower ability of our business to generate cash operationally. In addition to prepayment, the Company has started to offer credit solutions to clients. The Company intends to fund its credit operation primarily through third parties (i.e. FIDC and debt), as well as with some own cash. Given the operational nature of our credit business, as in the case of prepayment mentioned above, management does not view related funding decision as translating into higher or lower ability of our business to generate cash operationally.
28 Interest Income Received, Net of Costs, consists of two items: (i) financial income from our prepayment activity, less (ii) financial expenses related to the sale of receivables to commercial banks. The first item has direct influence on the level of Accounts Payable to Clients in our balance sheet; the second item has direct influence on the amount of Accounts Receivables from Card Issuers on our balance sheet.
23
Cash Flow
(b) Includes purchase of property and equipment, plus purchases and development of intangibles assets.
(c) Includes capital increase, repurchase of shares, acquisition of non-controlling interest and cash proceeds from non-controlling interest
Adjusted (non-IFRS) Free Cash Flow
The Company defines Adjusted Free Cash Flow29, a non-IFRS metric, as Adjusted net cash provided by (used in) operating activities (non-IFRS), less purchase of property and equipment and purchases and development of intangible assets ("Capex").
The Company reported negative Adjusted Free Cash Flow of R$299.8 million in the first quarter of 2021, compared to a negative R$122.3 million reported in the first quarter of 2020. The Adjusted Free Cash Flow in the first quarter of 2021 was impacted by (i) R$230 million in prepaid marketing expenses as a result of the agreement with Grupo Globo, (ii) R$160 million in prepaid POS purchases and (iii) R$46 million in prepaid software licenses.
Net Cash Provided by Operating Activities
In the first quarter of 2021, Net Cash Used in Operating Activities was R$89.2 million, compared with R$362.5 million of Net Cash Provided by Operating Activities in the first quarter of 2020, a difference of R$451.6 million. This negative variation is explained by (i) R$421.5 million higher Net Cash Used in Operating Activities from Working Capital and (ii) R$30.1 million lower Net Income adjusted by non-cash effects. The R$421.5 million negative variation from Working Capital is mainly explained by (i) R$556.6 million lower Net Cash Provided by Operating Activities from Accounts Receivable from Card Issuers and (ii) R$134.7 million higher Net Cash Used in Operating Activities from Prepaid Expenses, which includes R$230.5 million in prepaid media expenses to Globo in the first quarter of 2021. These effects were partially offset by (iii) R$212.0 million lower Net Cash Used in Operating Activities from Accounts Payable to Clients and R$57.8 million from other effects.
Adjusting for the effects on table 4 above, our Adjusted (non-IFRS) Net Cash Provided by Operating Activities30 was R$76.8 million, compared with Adjusted Net Cash Used in Operating Activities of R$10.1 million in the first quarter of 2020. The R$86.9 million higher Adjusted Net Cash Provided by Operating Activities is explained by (i) R$117.0 million higher Adjusted Net Cash Provided by Operating Activities from Working Capital, mainly from R$124.6 million higher Trade Accounts Receivable and other assets, and partially compensated by (ii) R$30.1 million lower Net Income adjusted by non-cash effects.
Net Cash Used in Investing Activities
Net Cash Used in Investing Activities was R$625.9 million for the first quarter of 2021, compared with Net Cash Provided by Investing Activities of R$494.5 million in the first quarter of 2020, a difference of R$1,120.3 million. This difference was driven by the combination of (i) R$213.7 million in Acquisition from Short-Term Investments, Net in the first quarter of 2021, which includes R$371.8 million from acquisition of Linx shares, compared to R$601.2 million in Proceeds from Short-Term Investments, Net in the first quarter of the previous year, a difference of R$815.0 million, (ii) R$264.4 million higher capex explained by a POS purchase advancement of R$160 million and investments in datacenter and IT equipment in order to support the growth of our operation and (iii) R$41.0 million higher other effects, mostly acquisition of interest in associates, related to the acquisition of a higher stake in DeliveryMuch.
29 Adjusted Free Cash Flow is a non-IFRS measure. Refer to the discussion on non-IFRS financial measures and reconciliations included in our 2020 Earnings Release.
30 Adjusted Net Cash Provided by (Used in) Operating Activities is a non-IFRS measure. Refer to the discussion on non-IFRS financial measures and reconciliations included in our 2020 Earnings Release.
24
Cash Flow
Net Cash Provided by (Used in) Financing Activities
Net Cash Provided by Financing Activities was R$153.9 million for the first quarter of 2021, compared with Net Cash Used in Financing Activities of R$304.4 million for the first quarter of 2020, a difference of R$458.3 million. This difference is mainly explained by (i) R$642.0 million higher Proceeds from Borrowings, net of repayments, since although we raised higher third-party capital in the first quarter of 2020 compared to 2021, we also repaid a higher amount of our borrowings in that period. This effect is partially offset by (ii) a R$0.9 million outflow from capital events in the first quarter of 2021, compared to an inflow of R$182.8 million in the first quarter of 2020, a difference of R$183.7 million. Included in the R$0.9 million outflow from the first quarter of 2021, are R$230.5 million in transaction with non-controlling interests from the flip with Globo, where Stone now owns 100% of TON and R$232.1 million in repurchase of shares.
Adjusting for the effects on table 4 above, our Adjusted (non-IFRS) Net Cash Used in Financing Activities31 was R$12.0 million in the first quarter of 2020, compared with Adjusted (non-IFRS) Net Cash Provided by Financing Activities of R$68.2 million in the first quarter of 2020, a difference of R$80.3 million. This difference is related to (i) R$538.5 million higher working capital used for prepayment and credit offerings, combined with item (ii) above and partially offset by item (i) above.
31 Adjusted Net Cash Provided by (Used in) Financing Activities is a non-IFRS measure. Refer to the discussion on non-IFRS financial measures and reconciliations included in our 2020 Earnings Release.
25
Adjusted Net Cash
Management assesses net liquidity of the Company by Adjusted Net Cash, a non-IFRS metric. It consists of the items detailed in the Table 5 below:
Table
5: Adjusted Net Cash
| Adjusted Net Cash (R$mm) | 1Q21 | 4Q20 |
| Cash and cash equivalents | 1,863.5 | 2,447.0 |
| Short-term investments | 8,673.8 | 8,128.1 |
| Accounts receivable from card issuers | 15,344.5 | 16,307.2 |
| Loans designated at FVPL | 1,993.7 | 1,646.7 |
| Derivative financial instrument (b) | 1.0 | 25.0 |
| Adjusted Cash | 27,876.4 | 28,553.9 |
| Accounts payable to clients | (8,406.6) | (9,172.4) |
| Loans and financing (a) | (2,282.1) | (1,534.2) |
| Obligations to FIDC quota holders | (3,813.6) | (4,374.6) |
| Derivative financial instrument (b) | (19.1) | (16.2) |
| Adjusted Debt | (14,521.4) | (15,097.4) |
| Adjusted Net Cash | 13,355.0 | 13,456.5 |
| (a) | Loans and financing were reduced by the effects of leases liabilities recognized under IFRS 16. |
| (b) | Refers to economic hedge of cash and cash equivalents and short-term investments denominated in U.S. dollars. |
Accounts Receivable from Card Issuers and Loans Designated at FVPL are accounted for at their fair value in our balance sheet.
As of March 31, 2021, the Company´s Adjusted Net Cash position was R$13,355.0 million compared with R$13,456.5 million on December 31, 2020, a decrease of R$101.5 million. The main factors for the decrease were a negative Adjusted Free Cash Flow of R$299.8 million and a repurchase of shares of R$232.3 million.
Below, we provide more details on each line item:
| ● | Cash and Cash Equivalents plus Short-term Investments decreased by R$37.8 million, from R$10,575.0 million on December 31, 2020 to R$10,537.3 million on March 31, 2021. |
| ● | Loans and financing plus Obligations to FIDC quota holders increased R$186.9 million from R$5,908.8 million on December 31, 2020 to R$6,095.7 million on March 31, 2021 as the company raised new CCBs (Bank Credit Notes) and received the proceeds from the second tranche of the FIDC SOMA III aimed at funding the credit solution. These effects were partially offset by the payment of some maturing borrowings and obligations to FIDCs in the quarter; |
| ● | Accounts Receivable from Card Issuers, net of Accounts Payable to Clients decreased by R$196.9 million, from R$7,134.8 million on December 31, 2020 to R$6,937.9 million on March 31, 2021, mainly explained by a lower use of debt and own capital compared to sale of receivables to commercial banks to fund the increase in our working capital solution to our clients; |
| ● | The Company invested R$347.0 million in its Loans Designated at FVPL, going from R$1,646.7 million on December 31, 2020 to R$1,993.7 million on March 31, 2021. The Company expects to scale its credit business mostly through third-party funding and has already begun to raise funds in the market through FIDC SOMA III, which raised R$493 million in third-party capital through December and January and FIDC SOMA IV, which raised R$340 million in May, with full settlement expected to occur in June, 2021. |
26
Other Information
Conference Call
Stone will discuss its first quarter financial results during a teleconference today, June 1, 2021, at 5:00 PM ET / 6:00 PM BRT. The conference call can be accessed at +1 (412) 317 6346 or +1 (844) 204 8586 (US), or +55 (11) 3181 8565 (Brazil), or +44 (20) 3795 9972 (UK).
The call will also be broadcast simultaneously on Stone’s Investor Relations website at https://investors.stone.co/. Following the completion of the call, a recorded replay of the webcast will be available on Stone’s Investor Relations website at https://investors.stone.co/.
About Stone Co.
Stone Co. is a leading provider of financial technology solutions that empower merchants to conduct commerce seamlessly across multiple channels and help them grow their businesses.
Investor Contact
Investor Relations
investors@stone.co
27
Other Information
Forward-Looking Statements
This press release contains "forward-looking statements" within the meaning of the "safe harbor" provisions of the Private Securities Litigation Reform Act of 1995. These forward-looking statements are made as of the date they were first issued and were based on current expectations, estimates, forecasts and projections as well as the beliefs and assumptions of management. These statements identify prospective information and may include words such as “believe,” “may,” “will,” “aim,” “estimate,” “continue,” “anticipate,” “intend,” “expect,” “forecast,” “plan,” “predict,” “project,” “potential,” “aspiration,” “objectives,” “should,” “purpose,” “belief,” and similar, or variations of, or the negative of such words and expressions, although not all forward-looking statements contain these identifying words.
Forward-looking statements are subject to a number of risks and uncertainties, many of which involve factors or circumstances that are beyond Stone’s control.
Stone’s actual results could differ materially from those stated or implied in forward-looking statements due to a number of factors, including but not limited to: more intense competition than expected, lower addition of new clients, regulatory measures, more investments in our business than expected, and our inability to execute successfully upon our strategic initiatives, among other factors. In particular, due to the high level of uncertainty with respect to the duration and scope of the COVID-19 crisis, the quantification of impacts on our financial and operating results cannot be reasonably estimated at this time.
About Non-IFRS Financial Measures
To supplement the financial measures presented in this press release and related conference call, presentation, or webcast in accordance with IFRS, Stone also presents the following non-IFRS measures of financial performance: Adjusted Net Income, Adjusted EPS (diluted), Adjusted Net Margin, Adjusted Net Cash Provided by / (Used in) Operating Activities, Adjusted Net Cash Provided by (Used in) Financing Activities, Free Cash Flow and Adjusted Free Cash Flow, Adjusted Net Cash / (Debt) and Adjusted Pre-Tax Margin.
A “non-IFRS financial measure” refers to a numerical measure of Stone’s historical or future financial performance or financial position that either excludes or includes amounts that are not normally excluded or included in the most directly comparable measure calculated and presented in accordance with IFRS in Stone’s financial statements. Stone provides certain non-IFRS measures as additional information relating to its operating results as a complement to results provided in accordance with IFRS. The non-IFRS financial information presented herein should be considered in conjunction with, and not as a substitute for or superior to, the financial information presented in accordance with IFRS. There are significant limitations associated with the use of non-IFRS financial measures. Further, these measures may differ from the non-IFRS information, even where similarly titled, used by other companies and therefore should not be used to compare Stone’s performance to that of other companies.
Stone has presented Adjusted Net Income to eliminate the effect of items from Net Income that it does not consider indicative of its continuing business performance within the period presented. Stone defines Adjusted Net Income as Net Income (Loss) for the Period, adjusted for (1) non-cash expenses related to the grant of share-based compensation and the fair value (mark-to-market) adjustment for share-based compensation classified as a liability, (2) amortization of intangibles related to acquisitions, (3) one-time impairment charges, (4) unusual income and expenses and (5) tax expense relating to the foregoing adjustments. Adjusted Net Margin is calculated by dividing Adjusted Net Income by Total Revenue and Income. Adjusted EPS (diluted) is calculated as Adjusted Net income attributable to owners of the parent (Adjusted Net Income reduced by Net Income attributable to Non-Controlling interest) divided by diluted number of shares.
Stone has presented Adjusted Net Cash Provided by/ (Used in) Operating Activities, in order to provide an additional view of cash flow from operations without the effect of funding decisions related to our financial solutions, that include prepayment business and credit solutions. Stone has presented Adjusted Free Cash Flow metric, which has limitations as it omits certain components of the overall Cash Flow Statement and does not represent the residual cash flow available for discretionary expenditures. For example, this metric does not incorporate the portion of payments representing principal reductions of debt or cash payments for business acquisitions. Therefore, the Company believes it is important to view Free Cash Flows measures only as a complement to our entire consolidated Statements of Cash Flows.
Stone has presented Adjusted Net Cash metric in order to adjust its Net Cash / (Debt) by the balances of Accounts Receivable from Card Issuers, Loans Designated at FVPL and Accounts Payable to Clients, since these lines vary according to the Company’s funding source together with the lines of (i) Cash and Cash Equivalents, (ii) Short-term Investments, (iii) Debt balances and (iv) Derivative Financial Instruments related to economic hedges of short term investments in assets, due to the nature of Stone’s business and its prepayment and credit operations.
28
Unaudited First Quarter Consolidated Statement of Profit or Loss
Table 6: Unaudited First Quarter Consolidated Statement of Profit or Loss
| Statement of Profit or Loss (R$mm) | 1Q21 | 1Q20 |
| Net revenue from transaction activities and other services | 318.3 | 227.3 |
| Net revenue from subscription services and equipment rental | 139.9 | 93.1 |
| Financial income | 368.8 | 359.3 |
| Other financial income | 40.6 | 37.0 |
| Total revenue and income | 867.7 | 716.8 |
| Cost of services | (239.7) | (149.9) |
| Administrative expenses | (117.6) | (73.9) |
| Selling expenses | (162.8) | (111.8) |
| Financial expenses, net | (92.5) | (148.4) |
| Other operating expenses, net | (41.5) | (3.5) |
| Loss on investment in associates | (3.6) | (1.3) |
| Profit before income taxes | 210.0 | 227.9 |
| Income tax and social contribution | (51.7) | (69.3) |
| Net income for the period | 158.3 | 158.6 |
29
Unaudited First Quarter Consolidated Balance Sheet Statement
Table 7: Unaudited First Quarter Consolidated Balance Sheet Statement
| Balance Sheet (R$mn) | 31-Mar-21 | 31-Dec-20 |
| Assets | ||
| Current assets | 28,809.5 | 29,274.8 |
| Cash and cash equivalents | 1,863.5 | 2,447.0 |
| Short-term investments | 8,673.8 | 8,128.1 |
| Accounts receivable from card issuers | 15,344.5 | 16,307.2 |
| Trade accounts receivable | 1,804.9 | 1,415.9 |
| Deposits from banking customers | 663.1 | 714.9 |
| Recoverable taxes | 56.0 | 56.4 |
| Prepaid expenses | 114.0 | 67.7 |
| Derivative financial instruments | 15.6 | 43.1 |
| Other assets | 274.1 | 94.7 |
| Non-current assets | 2,862.6 | 2,473.8 |
| Trade accounts receivable | 326.3 | 382.1 |
| Receivables from related parties | 9.8 | 7.2 |
| Deferred tax assets | 150.1 | 138.7 |
| Prepaid expenses | 245.9 | 51.2 |
| Other assets | 95.3 | 85.6 |
| Investment in associate | 83.4 | 52.0 |
| Property and equipment | 892.3 | 717.2 |
| Intangible assets | 1,059.6 | 1,039.9 |
| Total Assets | 31,672.1 | 31,748.7 |
| Liabilities and equity | ||
| Current liabilities | 12,921.3 | 13,380.4 |
| Obligations with banking customers | 536.6 | 576.1 |
| Accounts payable to clients | 8,403.1 | 9,172.4 |
| Trade accounts payable | 242.0 | 180.5 |
| Loans and financing | 1,931.2 | 1,184.7 |
| Obligations to FIDC quota holders | 1,460.5 | 1,960.1 |
| Labor and social security liabilities | 196.2 | 173.1 |
| Taxes payable | 121.4 | 106.8 |
| Derivative financial instruments | 19.1 | 16.2 |
| Other liabilities | 11.2 | 10.4 |
| Non-current liabilities | 3,355.5 | 3,376.3 |
| Accounts payable to clients | 3.5 | 0.0 |
| Loans and financing | 541.0 | 524.4 |
| Obligations to FIDC quota holders | 2,353.1 | 2,414.4 |
| Deferred tax liabilities | 69.4 | 61.1 |
| Provision for contingencies | 12.0 | 10.2 |
| Labor and social security liabilities | 79.9 | 81.3 |
| Other liabilities | 296.6 | 285.0 |
| Total liabilities | 16,276.8 | 16,756.6 |
| Equity attributable to owners of the parent | 15,333.6 | 14,853.5 |
| Issued capital | 0.1 | 0.1 |
| Capital reserve | 13,809.6 | 13,479.7 |
| Treasury shares | (308.4) | (76.4) |
| Other comprehensive income | 219.0 | (5.0) |
| Retained earnings | 1,613.4 | 1,455.0 |
| Non-controlling interests | 61.7 | 138.6 |
| Total equity | 15,395.3 | 14,992.0 |
| Total liabilities and equity | 31,672.1 | 31,748.7 |
30
Unaudited First Quarter Consolidated Statement of Cash Flows
Table 8: Unaudited First Quarter Consolidated Statement of Cash Flows
| Cash Flow (R$mm) | 1Q21 | 1Q20 | |
| Net income for the period | 158.3 | 158.6 | |
| Adjustments on Net Income: | |||
| Depreciation and amortization | 84.4 | 60.2 | |
| Deferred income tax and social contribution | (11.1) | (8.2) | |
| Loss (gain) on investment in associates | 3.6 | 1.3 | |
| Interest, monetary and exchange variations, net | (269.7) | 1.6 | |
| Provision for contingencies | 1.7 | 1.0 | |
| Share based payments expense | 22.1 | 7.1 | |
| Allowance for expected credit losses | 8.4 | 9.7 | |
| Loss on disposal of property, equipment and intangible assets | 10.3 | 11.8 | |
| Fair value adjustment in financial instruments at FVPL | 227.2 | 7.4 | |
| Fair value adjustment in derivatives | 31.7 | 46.7 | |
| Working capital adjustments: | |||
| Accounts receivable from card issuers | 978.1 | 1,534.7 | |
| Receivables from related parties | (1.7) | (7.4) | |
| Recoverable taxes | (4.2) | (48.4) | |
| Prepaid expenses | (241.0) | (106.4) | |
| Trade accounts receivable and other assets | (332.0) | (293.4) | |
| Accounts payable to clients | (1,115.8) | (1,327.8) | |
| Taxes payable | 64.9 | 76.7 | |
| Labor and social security liabilities | 21.7 | 9.0 | |
| Provision for contingencies | (0.2) | (1.4) | |
| Other Liabilities | 46.8 | (11.2) | |
| Interest paid | (46.5) | (55.3) | |
| Interest income received, net of costs | 318.8 | 349.5 | |
| Income tax paid | (45.0) | (53.2) | |
| Net cash provided by (used in) operating activity | (89.2) | 362.5 | |
| Investing activities | |||
| Purchases of property and equipment | (334.4) | (90.2) | |
| Purchases and development of intangible assets | (42.1) | (22.0) | |
| Proceeds from (acquisition of) short term investments, net | (213.7) | 601.2 | |
| Proceeds from the disposal of non-current assets | 0.1 | 0.0 | |
| Acquisition of interest in associates | (35.7) | 5.4 | |
| Net cash used in investing activities | (625.9) | 494.5 | |
| Financing activities | |||
| Proceeds from borrowings | 1,109.0 | 2,889.1 | |
| Payment of borrowings | (360.0) | (2,870.0) | |
| Payment to FIDC quota holders | (810.0) | (500.0) | |
| Proceeds from FIDC quota holders | 247.9 | 0.0 | |
| Payment of leases | (32.1) | (6.3) | |
| Repurchase of shares | (232.1) | (47.5) | |
| Acquisition of non-controlling interests | (0.3) | (0.2) | |
| Transaction with non-controlling interests | 230.5 | 0.0 | |
| Cash proceeds from non-controlling interest | 0.9 | 230.5 | |
| Net cash provided by financing activities | 153.9 | (304.4) | |
| Effect of foreign exchange on cash and cash equivalents | (22.4) | (2.3) | |
| Change in cash and cash equivalents | (583.5) | 550.3 | |
| Cash and cash equivalents at beginning of period | 2,447.0 | 968.3 | |
| Cash and cash equivalents at end of period | 1,863.5 | 1,518.6 |
31
Glossary of Terms
| · | “ABC Platform”: integrated financial platform including our acquiring, banking and credit solutions in a single interface. |
| · | “Active Clients (ex-TON)”: refers to Stone SMBs, Pagar.me SMBs and Pagar.me FaaS clients. Does not include TON micromerchants. Considers clients that have transacted at least once over the preceding 90 days. |
| · | “Active Clients - Financial Operating System for SMBs”: refers to Stone SMBs, Pagar.me SMBs and TON micromerchants. Considers clients that have transacted at least once over the preceding 90 days, except for TON active clients which considers clients that have transacted once in the preceding 12 months. |
| · | “Banking Money-In Volumes”: includes money-in volumes from TED, PIX, boleto issuance and TPV from other acquirers settled in the Stone account. |
| · | “Banking Money-Out Volumes”: includes money-out volumes from TED, PIX, boleto payments and bill payments. |
| · | “Coronavoucher”: government financial aid program created amid COVID, targeting the most vulnerable part of the population as autonomous and informal workers and people without income. |
| · | “Financial Operating System for SMBs”: refers to our payments and financial services business serving bricks-and-mortar SMBs in the hubs, online clients in Pagar.me SMB business and micromerchants in TON. Includes money-in, money-out and working capital solutions, including digital banking, credit and online checkout. |
| · | “Heavy Users”: Stone SMB clients that are active in payments, banking and credit solutions at the same time. Active clients are clients that have transacted at least once over the preceding 90 days. |
| · | “Offline SMBs”: Brick-and-mortar SMBs, mostly served through our hub operations. |
| · | “Online SMBs”: Online SMBs at Pagar.me. |
| · | “Pagar.me Fintech-as-a-Service” or “Pagar.me FaaS”: refers to operations in which Pagar.me acts as a fintech infrastructure provider for different types of clients, especially larger ones, such as mature ecommerces and digital platforms, commonly delivering financial services via APIs. |
| · | “Pagar.me SMBs”: refers to SMB clients with our online payments solutions. |
| · | “SMBs”: from now on, when we refer to SMBs, we will be referring to the combination of our Stone SMBs, Pagar.me SMBs and TON micromerchants. |
| · | “Software Workflow Tools”: refers to our software ecosystem with solutions in different verticals for all sizes of clients. |
| · | “Stone SMBs”: refers to SMB clients with our brick-and-mortar solutions, being the vast majority served through the Stone hubs. |
| · | “Take Rate”: Total Revenue and Income minus Other Financial Income, divided by TPV. |
32
Glossary of Terms
| · | “TON”: refers to our solution for micromerchants. |
| · | “TON Active Client Base”: refers to clients that have transacted with TON at least once over the preceding 12 months. |
| · | “Total Account Balance”: accounts balance from our brick-and-mortar SMBs at Stone, our online SMBs at Pagar.me and our micromerchants under TON. |
| · | “TPV”: Total Payment Volume. Up to the fourth quarter of 2020, refers to processed TPV. From the first quarter of 2021 onwards, reported TPV figures consider all volumes settled by StoneCo. |
33